Home bias is the concept of having a strong affinity for investing in assets from one’s own country. For Australian investors, this means there is a strong bias towards investing in local assets such as equities, fixed income, and property. And while home bias is an understandable phenomenon as investors are often told to “stick to what they know,” Australian investors are missing out on potential opportunities from around the world – particularly considering directly held domestic shares are still the mainstay of many portfolios. Though some would consider this approach tried and true, it has a few distinct downfalls that may prevent portfolios from performing to their utmost potential. Hence, to help beat home bias, investors can use ETFs to access a range of international markets.
Let’s X-Plain:
- Why is home bias a potential portfolio killer?
- How can capital growth be increased by investing internationally?
- Why use ETFs to access global markets?
Why is Home Bias a Potential Portfolio Killer?
According to the latest ASX Investor Study, 58% of local investors have directly held Australian shares in their portfolio, making them the most popular option in the country. Meanwhile, only 16% directly hold international shares.1
Besides being more aware of the companies listed in Australia, local investors have generally been attracted to domestically listed shares because of franking credits. Franking credits generally increase tax efficiencies as they avoid tax being paid twice: once by the company on profits generated and once by the investor through any dividends collected. Currency risk may also be a consideration for local investors as the US dollar is comparatively stronger than the Australian dollar.
How to Increase Capital Growth by Investing Internationally?
By only investing in Australia, investors may miss out on the scale, sector and stock performance of other countries and regions.
Australia’s market size is a key factor compounding the effects of home bias. It represents only 2% of the global market, while in comparison, the US constitutes around 60%. This can be detrimental to portfolio performance as Australian investors are not capturing the potential growth and returns of larger markets.2
In addition to overall size, sector weightings in each market play a notable role in performance. Seven out of the top ten companies listed on the ASX fall into the financial or materials sectors, and make up a significant portion of the S&P/ASX 200.3 These blue-chip stocks, seen as the cornerstones of the Australian economy, are generally characterised by their consistent performance, dividend distributions and value. However, the growth potential of these industries is often reduced, given their limited ability to innovate in line with broader megatrends.
Meanwhile, information technology (IT) is one of the smallest sectors in the Australian market, making up approximately 2.5%.4 This indicates that Australian portfolios are likely underweight in this sector and may miss out on its potential growth and returns. In the US however, IT represents not only a larger portion of key indices such as the Nasdaq 100 and S&P 500 but represent a strong cohort of technology-focused stocks which have driven outperformance in recent years.
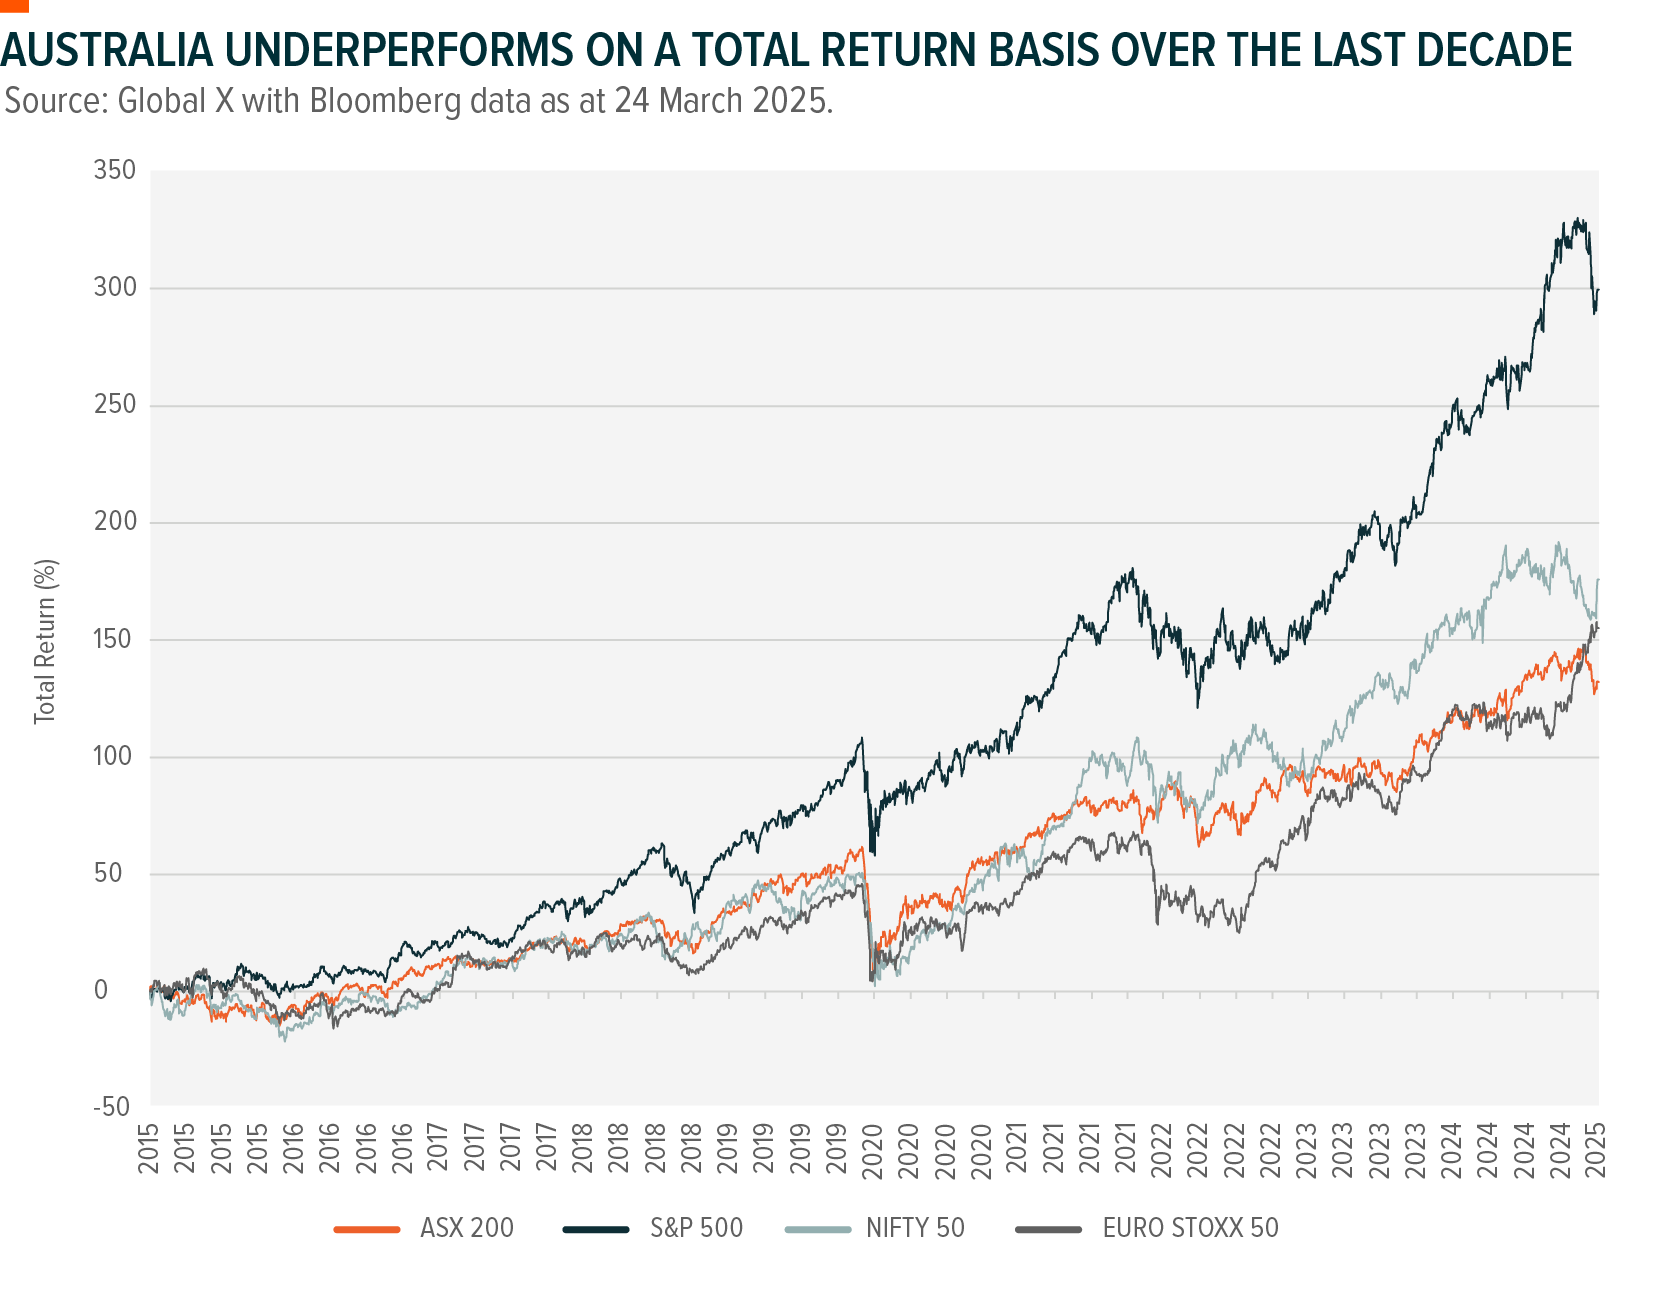
The below chart highlights how the S&P/ASX 200 has performed in comparison to the US’s S&P 500, EURO STOXX 50 and India’s Nifty 50 over the last 10 years. This underscores the potential capital gains which could have been realised by incorporating international investments into a well-diversified portfolio.