As H1 2026 comes to a close, investors reflecting on the chaos and volatility that defined global markets may view gold’s underperformance since the outbreak of the Iran War in February as a particularly unexpected oddity. For many investors with a high-level understanding of gold’s price drivers, it may seem confusing that this so called “safe haven” asset has failed to provide meaningful protection during what some have described as one of the largest energy market disruptions in history.
Below, we make the case that gold has in fact behaved largely as expected, with several rational factors explaining its recent underperformance. We also explain why the current environment could present an attractive opportunity to re-enter or accumulate the asset, as momentum strategies in other parts of the market begin to waver and structural tailwinds reassert themselves.
Key Takeaways
- Gold’s underperformance amid the Iran War can be explained by a combination of factors including starting at a high base, higher US treasury yields, and the lack of demand for haven assets as risk assets continued to perform.
- While temporary headwinds exist, long-term structural trends remain strong including central banks purchasing and Asian ETF accumulation.
- It is important to note that gold’s recent price action, in particular its recent high correlation to equities, represents a historical abnormality and analysis reveals that returns tend to be positive following these periods.
When The Tide Turns
The most common enquiry we have received over the past quarter, as managers of Australia’s largest gold fund1, is: why has gold underperformed during the Iran War?
It is a valid question. For many investors, gold is understood primarily as a “safe haven” asset, meaning it is expected to outperform, or at least hold steady, when traditional assets come under pressure or geopolitical tensions flare. However, we believe this view is too simplistic. Gold’s recent price action can only be properly understood by considering the broader market context.
In our view, gold’s disappointing performance over the past quarter can be attributed to three key factors.
1. The Higher You Fly…
The first and most intuitively understood factor is gold’s starting point prior to its sell off in late Q1. By the end of February, gold’s trailing 12-month returns had exceeded 80%, making it one of the top performing assets across markets and a natural target for profit taking.2 Volatility had risen in step, with the metal recording some of its largest one day moves in more than a decade.3 Signs of froth were also visible beyond financial markets. In Sydney, lines outside bullion dealers were wrapping around street corners as retail interest surged.
Through the period, professional investors appeared to anticipate the impending drawdown. Managed money positions declined by roughly 40,000 contracts in early February despite gold holding above US$5,000 for most of the month.
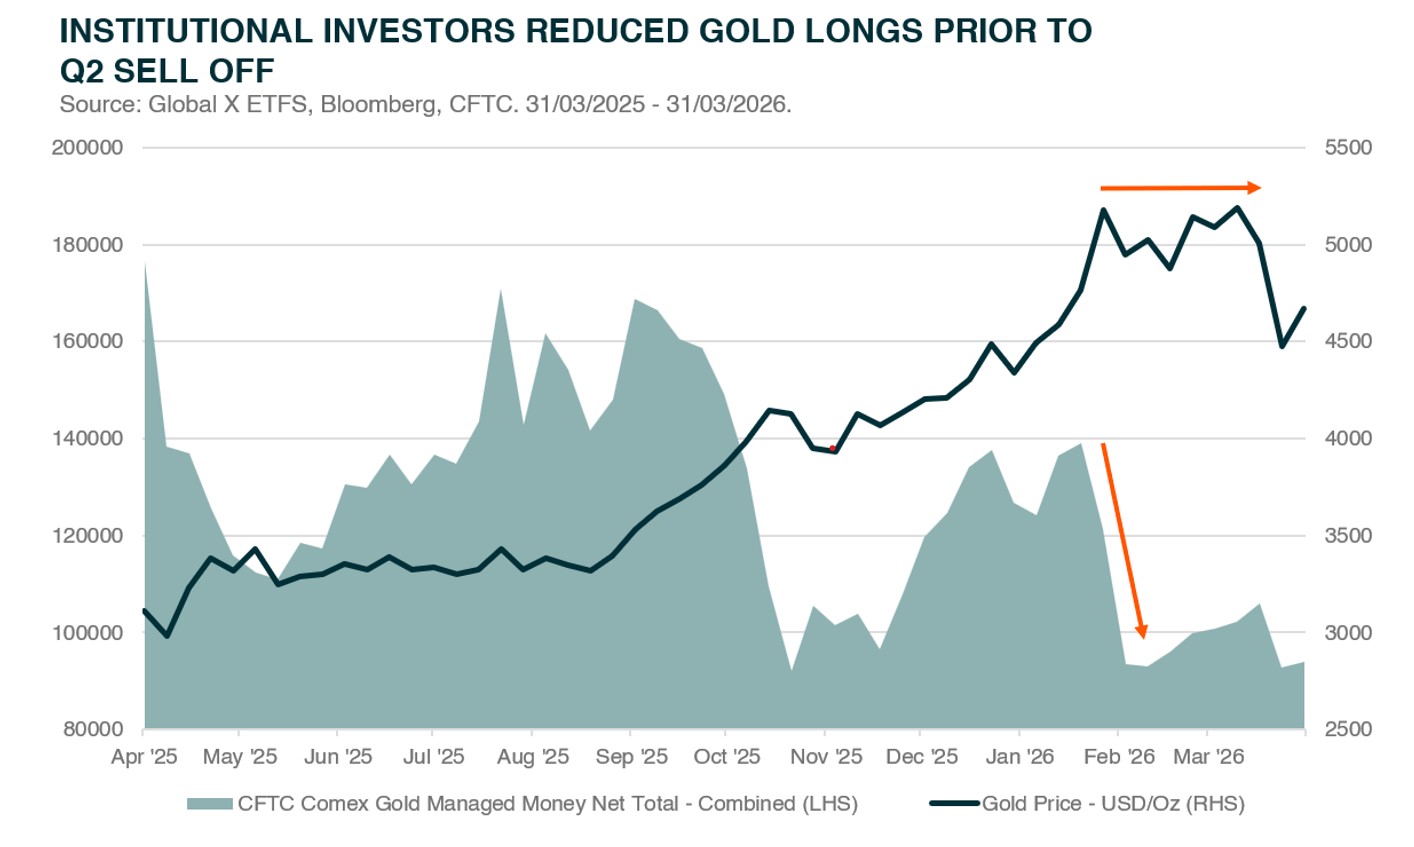
By the time uncertainty from the Iran War hit the market, the rally had become increasingly dependent on retail speculation. With liquidity tightening and institutional support fading, a sharp drawdown and normalisation in price action looked increasingly likely.
2. Oil, Inflation, Yields
Second, the Iran War has been perhaps the most energy-centric conflict markets have seen in modern history, with more than 20% of the world's crude oil and natural gas exports at risk.
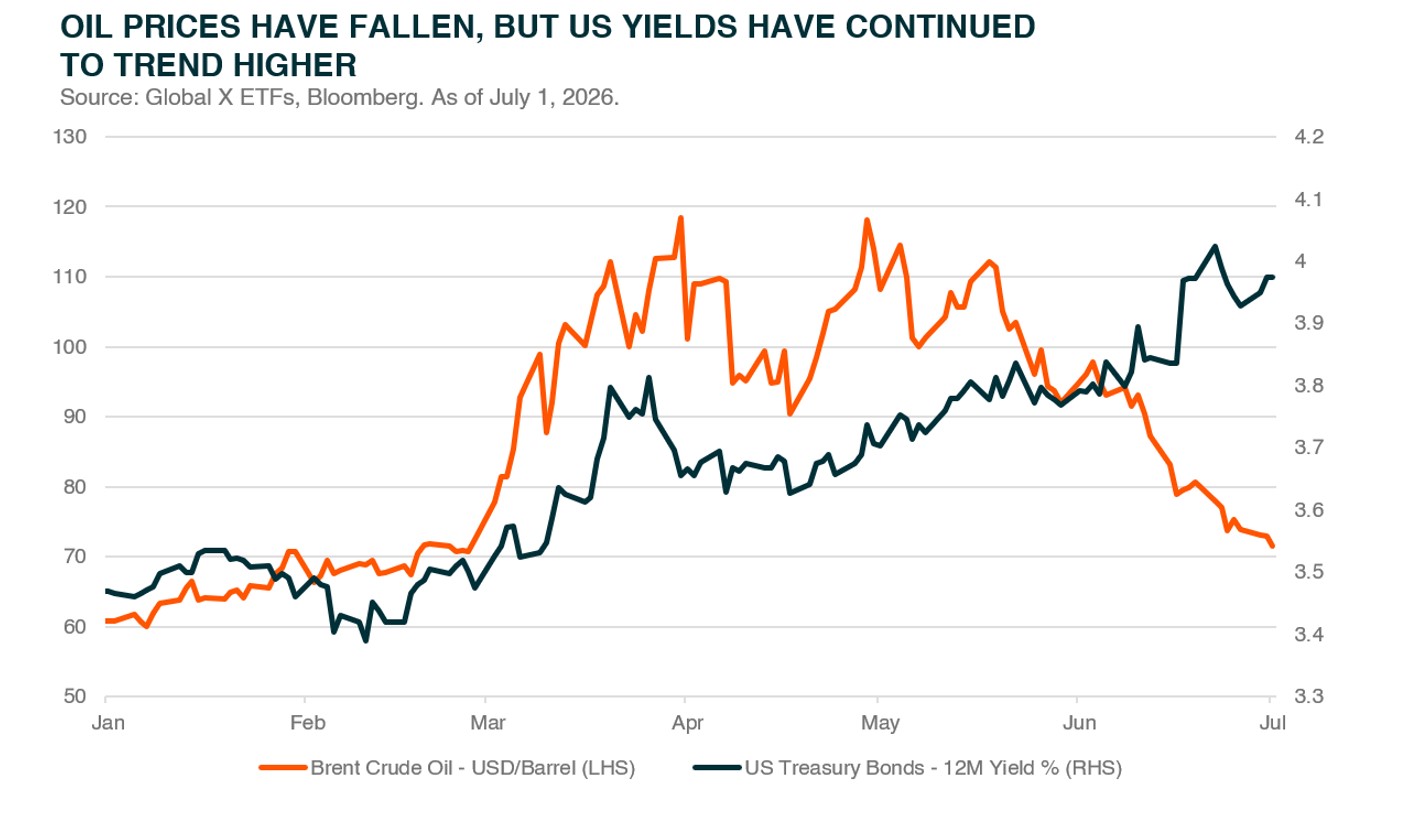
For gold, this may look supportive at first glance, given oil's direct link to inflation and gold's long-standing reputation as an inflation hedge. However, higher inflation expectations can also force markets to price in tighter monetary policy, and gold also has a strong, long-held inverse relationship to yields. So as rates rose to 12-month highs through the course of the Iran War, gold naturally came under pressure as a non-yielding asset, compounding the sell-off that began in Q1.
As for why gold remains in the doldrums despite oil's recent declines - hot inflation, a stronger-than-expected labour market, and a perceived hawkish Fed have pushed markets to price out the rate cuts they had pencilled in earlier in the year. With that repricing keeping US Treasury yields near year-to-date highs as of early July, gold has been left without the tailwind a softer rate path would have provided.
3. No Need for Safety
Finally, though geopolitical volatility intensified during the Iran War, markets did not view the conflict as threatening a systemic breakdown. Instead, clear pockets of “earnings certainty” remained, particularly across the semiconductor industry. As a result, despite uncertainty reaching decade highs, investors remained firmly risk on.
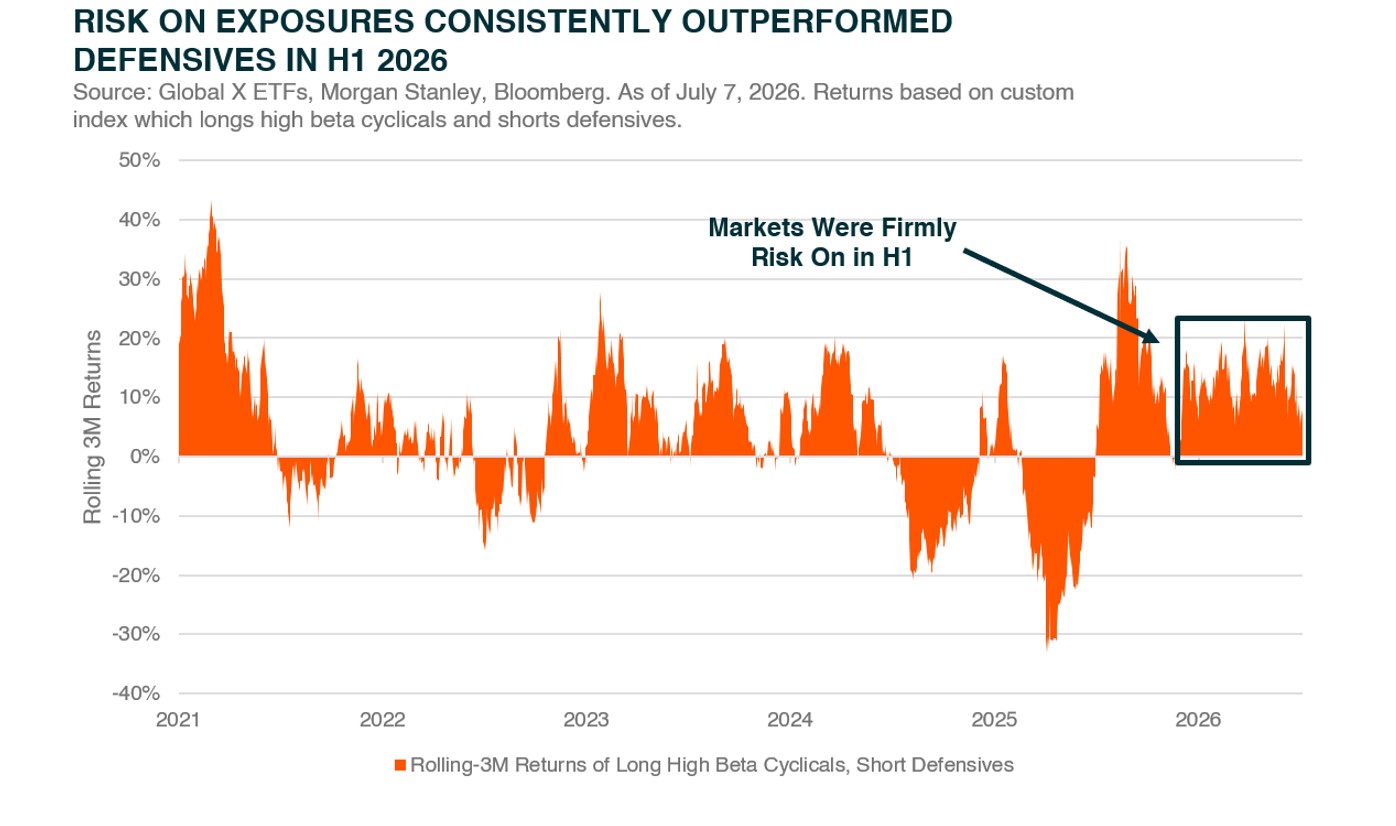
This is best illustrated by the chart above, which tracks rolling three month returns of a custom index that goes long high beta cyclical equities, including technology and semiconductor stocks, while shorting traditionally defensive sectors. The index shows that H1 2026 was decisively risk on, limiting demand for gold’s safe haven qualities and diverting investor liquidity toward higher growth assets.
Combining the three factors, it is clear to say that the first half represented a challenging environment for gold from several angles, making its underperformance understandable.
Is The Investment Case Still Intact?
While much has been made of crude oil, inflation and in turn rising yields as headwinds for gold (as is clear in the previous section), it is important to remember that the metal still outperformed in both 2024 and 2025 despite operating in a rising yield environment. This was supported by additional demand from non-traditional buyers, including central banks and Asian investors, which shifted marginal price setting power away from Western ETFs that are more sensitive to interest rate fluctuations.
With this in mind, the key question for gold investors heading into H2 2026 is not necessarily the outlook for geopolitics or interest rates, but whether these buyers will return to the market and once again become the dominant drivers of price. We believe that they will.
Central Bank Demand to Return
Central bank demand is perhaps the most important pillar of gold’s investment case over the coming years. However, over the past quarter, investors have begun to question the sustainability of this accumulation trend. Gold prices have fallen, the US dollar has strengthened, and many central banks remain on the sidelines, marking a sharp departure from 2025. While we admit central bank purchases have undoubtedly slowed in the first half of 2026, this moderation needs to be viewed in context.
The priorities of most central banks are centred on maintaining price stability and supporting economic and financial stability. During periods of heightened uncertainty, such as the Iran War, preserving sufficient liquidity to contain the effects of a potential energy crisis naturally becomes a more immediate priority, while long term strategic asset allocation (i.e. diversification away from US dollar assets) takes a back seat.
However, as energy markets normalise, we believe the de-dollarisation impulse that drove gold accumulation between 2022 and 2025 is likely to re-emerge, potentially at an even stronger pace. Intuitively, the Iran War only provides further evidence to international actors that the United States has become increasingly assertive in its use of both financial and military power. As the current administration accelerates the fragmentation and deglobalisation of the world, nation states are only further incentivised to diversify away from US assets and reduce their strategic reliance on the dollar.
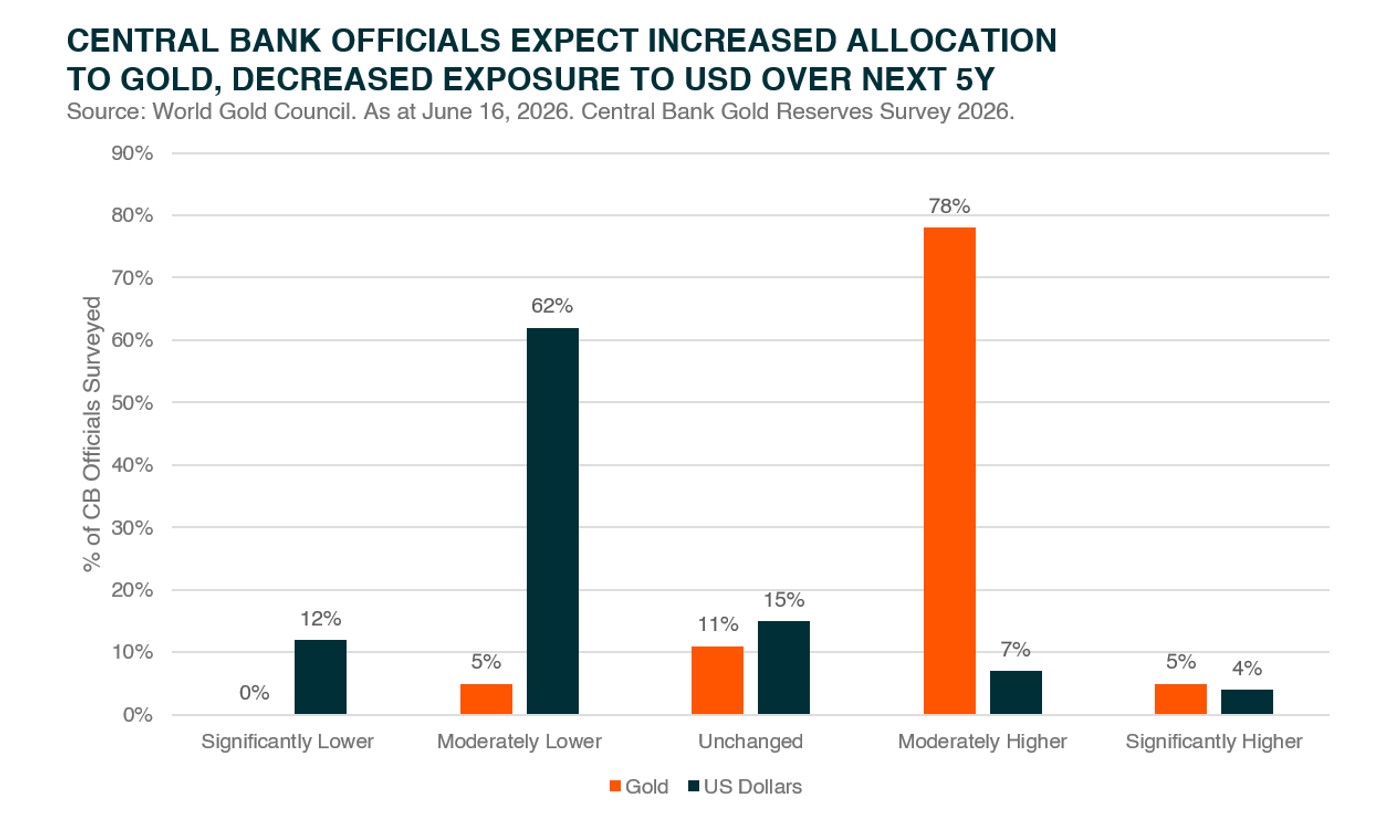
This intuition is supported by the World Gold Council’s recent survey of global central bank officials regarding their expected asset allocation over the next five years. More than 80% of respondents expect central banks’ gold reserves to increase over that period, supporting the view that the current lull represents a comma rather than a full stop. At the same time, almost three quarters of officials expect the US dollar’s share of global reserves to decline.
Together, these findings point to a continuation of the de-dollarisation trend, with gold positioned as one of its primary beneficiaries.
Asian ETF Buyers Show Resilience
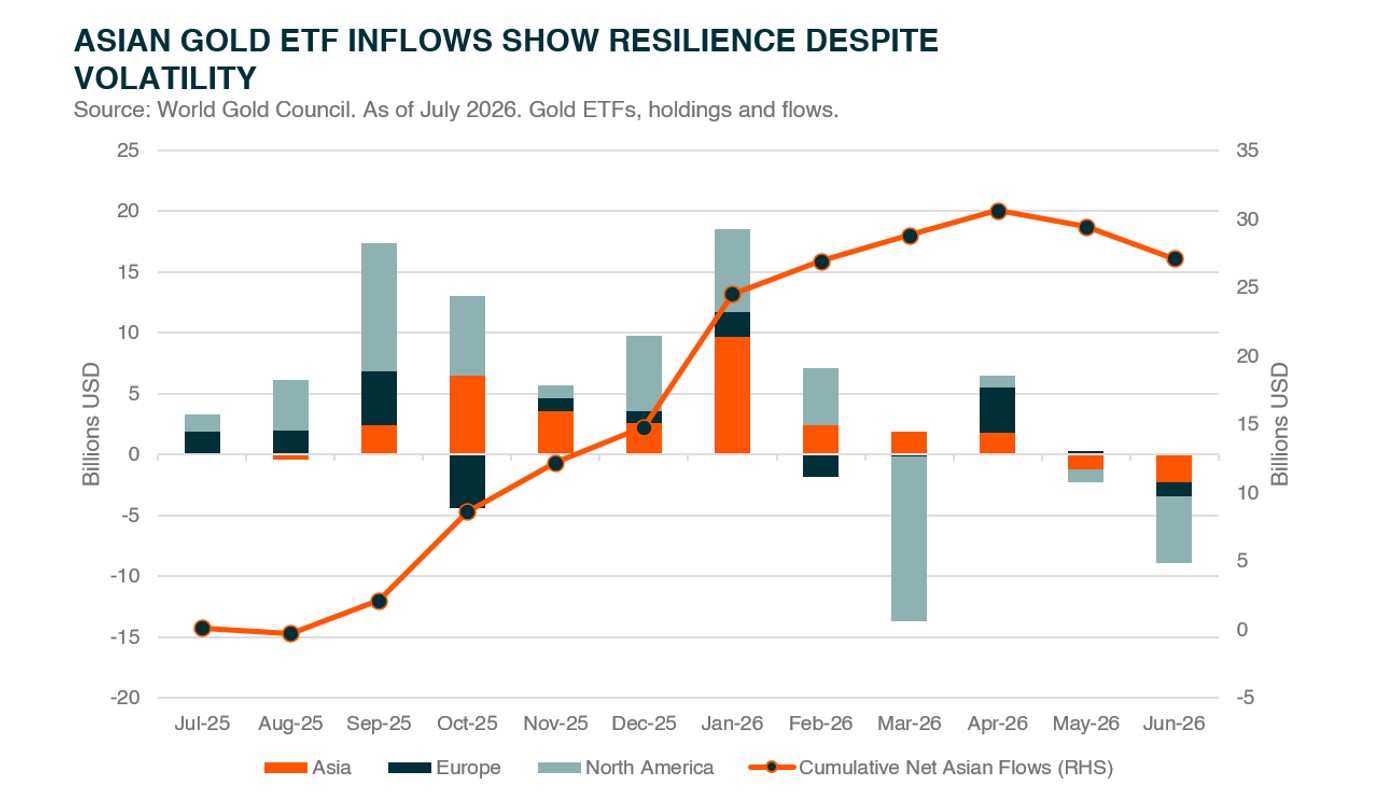
In late 2025, we identified Asian gold ETFs as a surprising and increasingly influential entrant into the gold investment landscape. This cohort has continued to exceed expectations, recording resilient inflows throughout much of the Iran War, with regional fund flows only recently turning mildly negative. As of H1 2026, inflows into Asian gold ETFs were 11% higher year-on-year.4
Perhaps the clearest evidence of this growing adoption came recently when a physical gold ETF (Huaan Yifu Gold) became the largest ETF of any kind in mainland China, overtaking a major CSI 300 tracker (the Chinese equivalent of the S&P 500).5 In our view, the significance of this milestone is more than a statistic, it reflects a shift in the way Chinese investors perceive gold: away from simply being a precious commodity or form of jewellery and towards becoming a financial asset and strategic component of a diversified portfolio.
We believe this evolving framework around gold allocation could provide a sustained tailwind for the foreseeable future. Asian investors may also demonstrate greater long-term discipline than more tactical Western flows as they progressively build positions towards their desired portfolio allocations. This dynamic is already evident in the relatively muted outflows from regional gold ETFs despite gold’s recent severe underperformance.
Across the three quarters from Q3’25 to Q1’26, Asian gold ETFs attracted approximately US$28.7 billion in inflows. By comparison, outflows in Q2’26 totalled just US$1.6 billion, leaving the region with roughly US$27.1 billion in cumulative net inflows over the past 12 months.
Some Guidance From History
To close out this performance review, it is also important to recognise that gold’s performance relative to other assets, particularly equities, has been highly unusual. As of early July, gold’s rolling 90-day correlation with global equities stood at 0.74, its highest level since the metal returned to open market trading following the collapse of Bretton Woods.
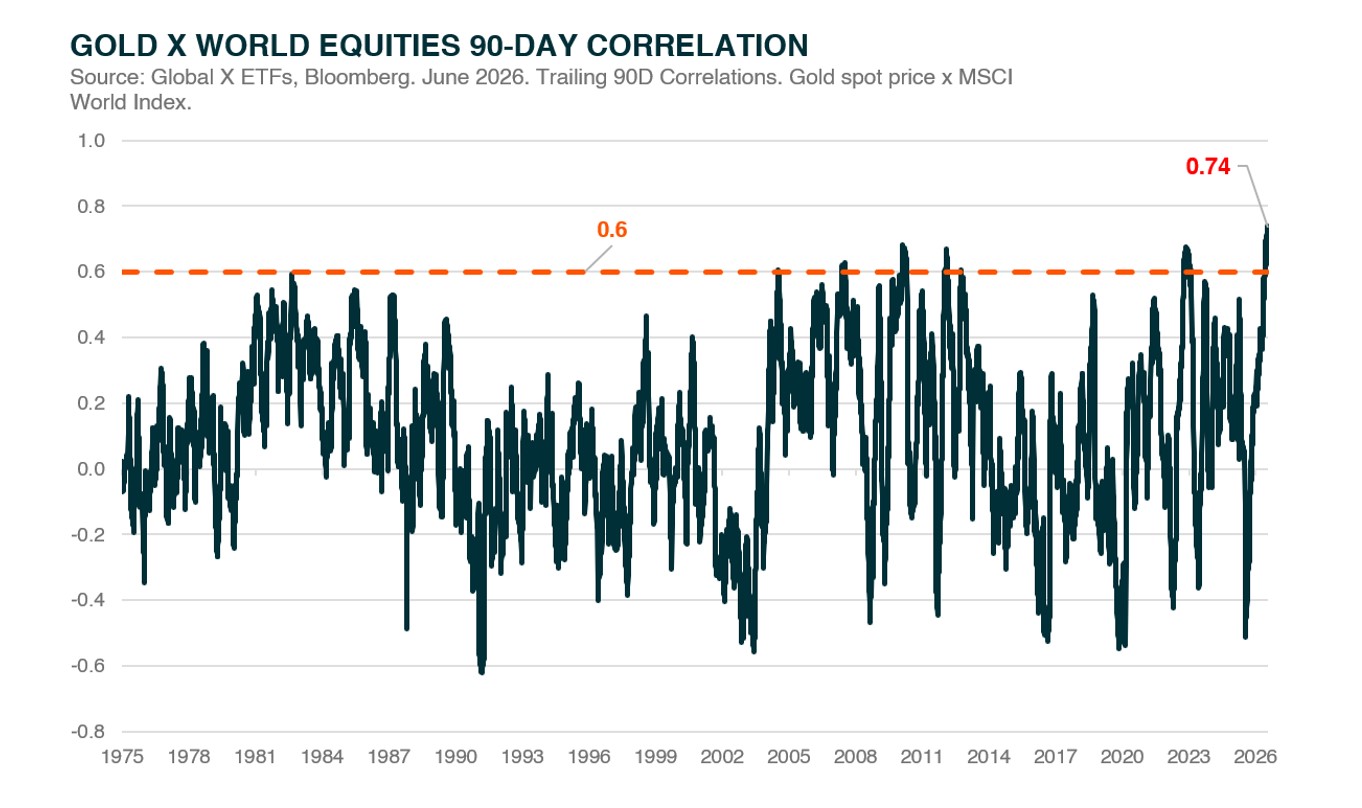
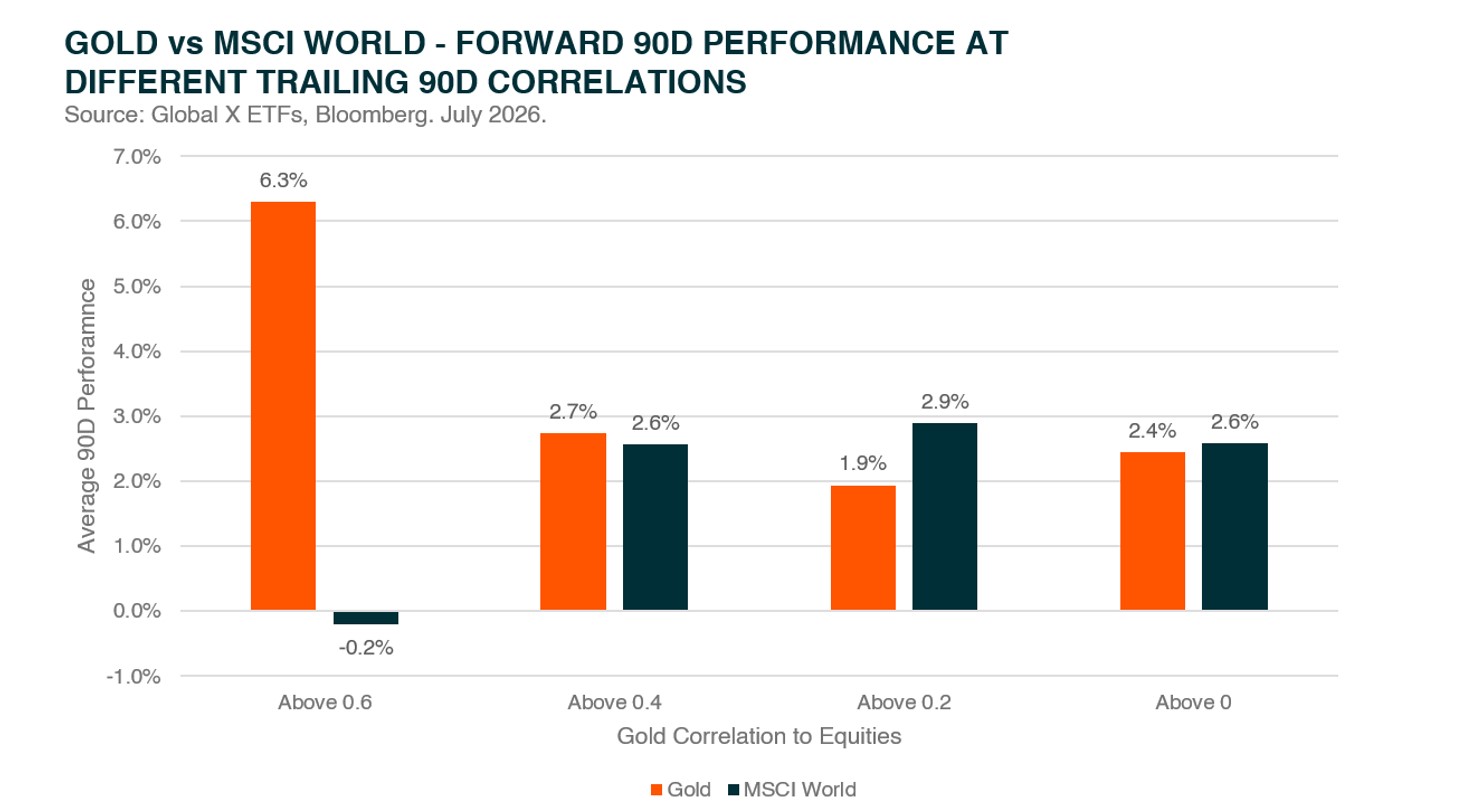
Across the past 50 years, there have been only five periods in which gold’s 90-day correlation with equities exceeded 0.6, with the average episode lasting just 27 days.6 So, what is driving this unusual relationship?
Looking beyond the fundamental price drivers already discussed, we believe periods of high correlation between gold and equities are best understood as a temporary clash between opposing investor philosophies. One side expresses waning confidence in global economic health and financial stability, while the other reflects a belief in continued growth and resilience. Gold and equities rarely move together for long because these views are fundamentally at odds.
With this in mind, we expect gold to decouple from equities over the near to medium term, implying one of two outcomes: either gold outperforms equities, or equities outperform gold.
Historical analysis suggests that gold investors have more often emerged victorious from this clash of views. Over the past 50 years, gold has outperformed equities by an average of 6.5% in the 90 days following periods in which their correlation exceeded 0.6. Of course, past performance is not a reliable indicator of future performance, but history often rhymes, even if it does not repeat perfectly.
Conclusion: From Ebb to Flow
Gold's first half tested the conviction of even its most ardent supporters, but conviction and price rarely move in lockstep. What looked like a broken thesis was, on closer inspection, a textbook reaction to headwinds, most of which are transitory.
Beneath the surface, the structural currents that carried gold through 2024 and 2025 (i.e. central bank diversification and a maturing Asian investor base) remain firmly in motion. History, too, offers some reassurance. We do not claim to know precisely when sentiment turns, and past performance guarantees nothing. But with the froth cleared and the fundamentals intact, it’s possible the tide could already be starting to turn.
Related Funds
GOLD: Global X Physical Gold Structured (ASX: GOLD) invests in physical gold via the stock exchange, offering higher liquidity and removing the need for investors to personally store bullion.
GXLD: The Global X Gold Bullion ETF (ASX: GXLD) invests in physical gold via the stock exchange at a low management fee for long-term investment.
GHLD: The Global X Gold Bullion (Currency Hedged) ETF (ASX: GHLD) aims to track the performance of the price of gold, hedged for currency movements in the AUD/USD exchange rate (before fees and expenses). It is the lowest cost currency hedged gold product on the ASX