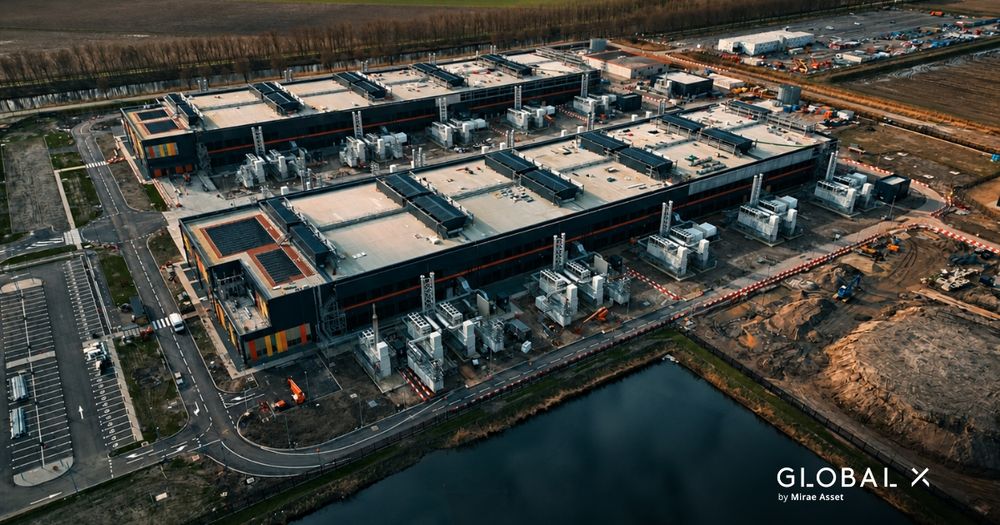
When geopolitical tension, trade policy uncertainty, and macro volatility made conviction difficult, investors concentrated in what they could anchor to, AI, semiconductors, and the platforms scaling compute. That trade was real, and it dominated the conversation. But while attention was fixed on the headline names, something quieter was happening underneath. The equities behind US physical infrastructure, the roads, bridges, power grids, and construction networks that hold the economy together, were compounding steadily in the background, supported by contracted backlogs, legislative mandates, and disciplined execution rather than narrative or sentiment.
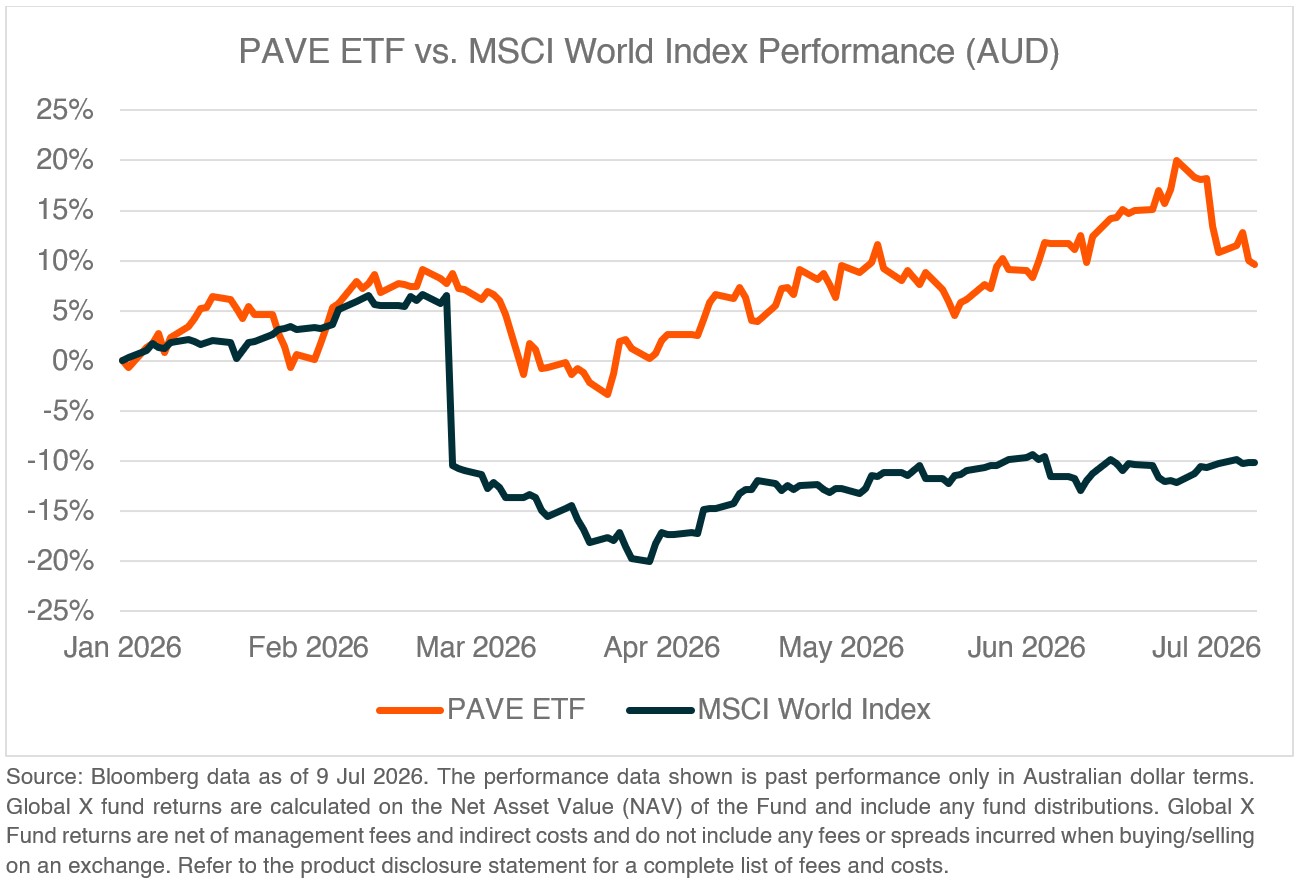
The sovereign capital thesis we laid out in The Security Premium identified a world in which governments are no longer asking which supplier is cheapest but which supply chains they can control and what it costs to own strategic capacity rather than rent it from the global market. US domestic physical sovereignty sits at the centre of that shift, and this year the evidence for it has been sitting in plain view, double-digit outperformance year to date without a single dominant catalyst, and inflows arriving even without a clear thematic narrative pulling capital in.
Key Takeaways
- The market rotated toward AI and semiconductors during H1 2026 as the place to express conviction, overlooking US domestic infrastructure equities compounding on contracted earnings rather than sentiment.
- Committed federal infrastructure funding is appropriated, not proposed, and the demand it created doesn't depend solely on legislative renewal to persist.
- Grid and electrical equipment pricing is still accelerating even as manufacturers expand capacity, and the valuation multiple has yet to reflect the earnings quality this implies.

The Spending Was Never Discretionary
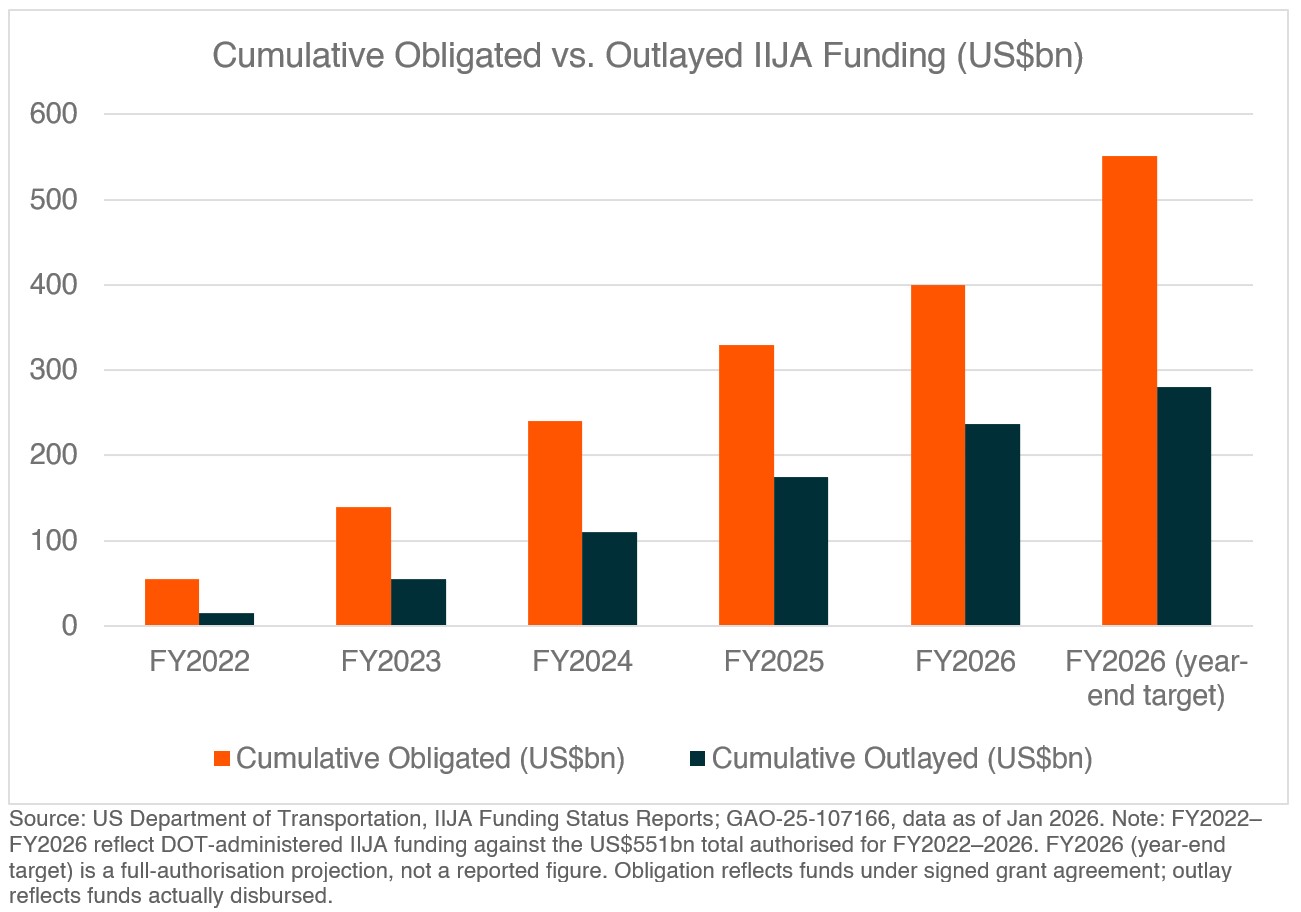
Unlike a stimulus package designed to smooth a cyclical downturn, federal infrastructure funding is a structural commitment that will take years to deploy and decades to depreciate. As of January 2026, 72.6% of US Department of Transportation-administered Infrastructure Investment and Jobs Act (IIJA) funding had been formally obligated under signed grant agreements, legally committing the government to the spend, while only 43% had actually been outlaid, meaning the bulk of this cycle's earnings are still working their way through construction rather than sitting at risk of being unwound.1 Current authorisation lapses after 2026, and no replacement funding has been confirmed, but the demand environment this cycle has built doesn't rest on renewal alone. Hyperscaler AI capital expenditure has grown from US$116bn in 2020 to roughly US$800bn in 2026 and is forecast to exceed US$1 trillion by 2030,2 more than double total public infrastructure spending, a dynamic the Global X Artificial Intelligence Infrastructure ETF (AINF) captures more directly, but one that means the physical construction and equipment demand underpinning this cycle was never solely reliant on legislative renewal to begin with.
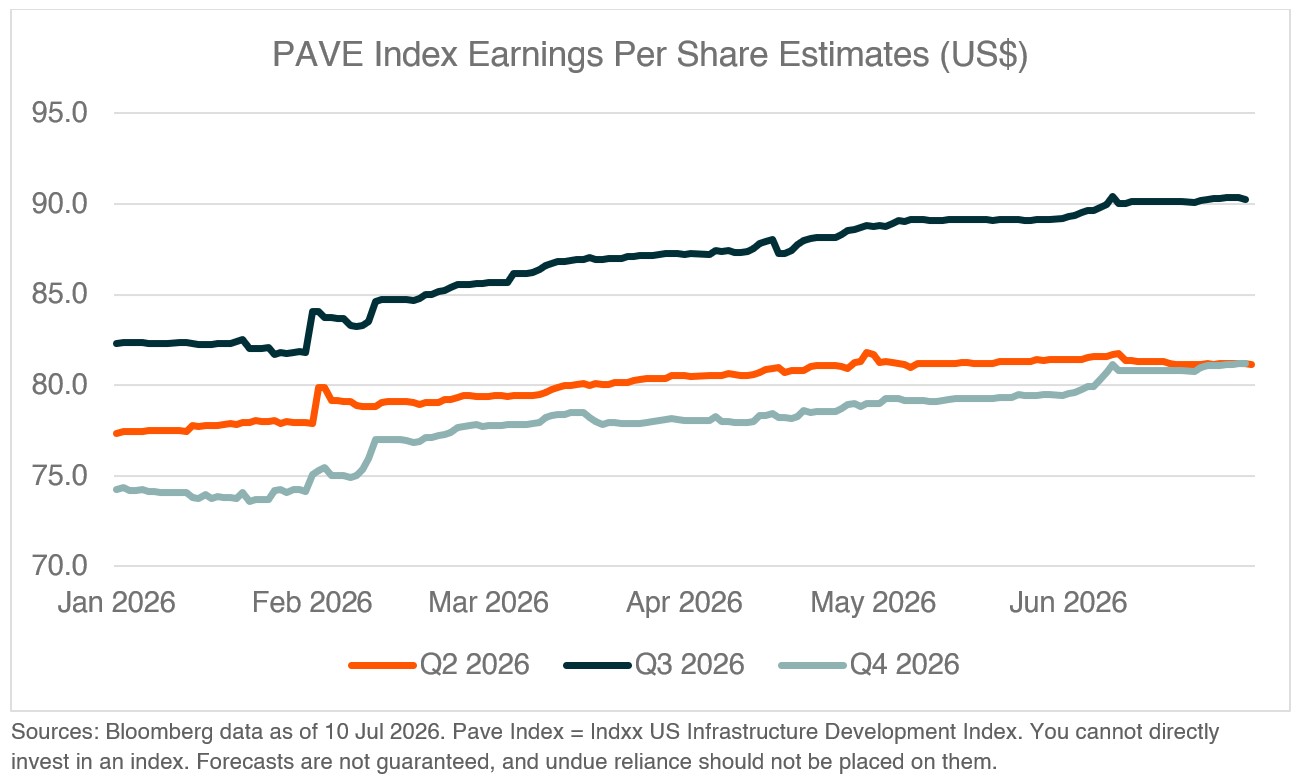
The earnings picture backs this up beyond volume alone. Consensus estimates for the sector's underlying earnings have been revised steadily higher through 2026 rather than held flat, with 2026 earnings growth forecast at 29%, ahead of the broader market's roughly 25%.3 More tellingly, earnings growth holds even as revenue growth turns negative in 2027, implying further margin expansion ahead rather than earnings that depend solely on volume. That's a demand signal that doesn't require the market's attention to keep compounding.
Capacity, Not Demand, Sets the Ceiling
The more durable argument sits on the supply side. Switchgear pricing inflation is running at roughly 12% year on year and transformer pricing inflation around 6%, and both are still accelerating even as manufacturers invest heavily in new capacity. That combination, rising prices alongside rising capacity, only happens when demand keeps outrunning supply rather than the other way around. Leading electrical equipment makers have held pricing elevated while actively ramping production, with utility-side demand sustained enough to support pricing rather than reflecting a temporary spike.
The input side confirms the constraint is physical rather than transitory. Steel and copper are both running at double-digit annual inflation heading into 2026, while labour cost inflation has actually normalised to around 3.5%, close to its long-run average.4 That distinction matters as labour-driven bottlenecks resolve as wages draw in more workers. An equipment and materials bottleneck doesn't resolve that way, since building the capacity to make more transformers and switchgear takes years, not quarters. AI and data centre buildout is layering a second source of demand onto the same constrained equipment base, but the underlying point is that the US domestic grid and construction supply chain was already tight before that demand arrived.
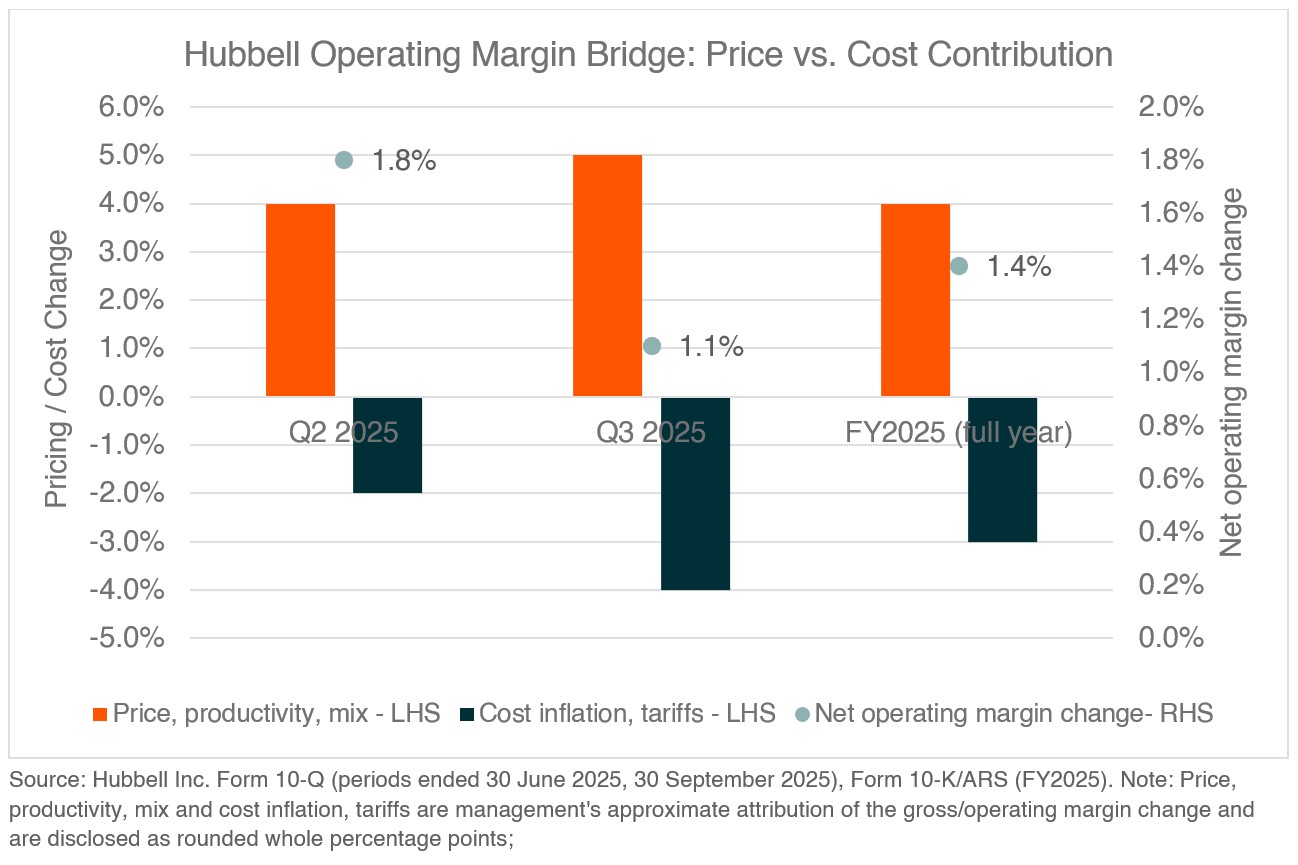
Rising input costs alone would compress margins if pricing couldn't keep pace, but at the company level this isn't happening. Hubbell, a leading electrical equipment manufacturer and one of the sector's largest holdings, shows this directly, gross and operating margin expanded in every reported period through 2025, price, productivity, and mix gains consistently outweighing material and tariff cost inflation, evidence the pass-through is working rather than being absorbed.
Falling Oil Doesn't Just Add a Tailwind, It Removes a Headwind
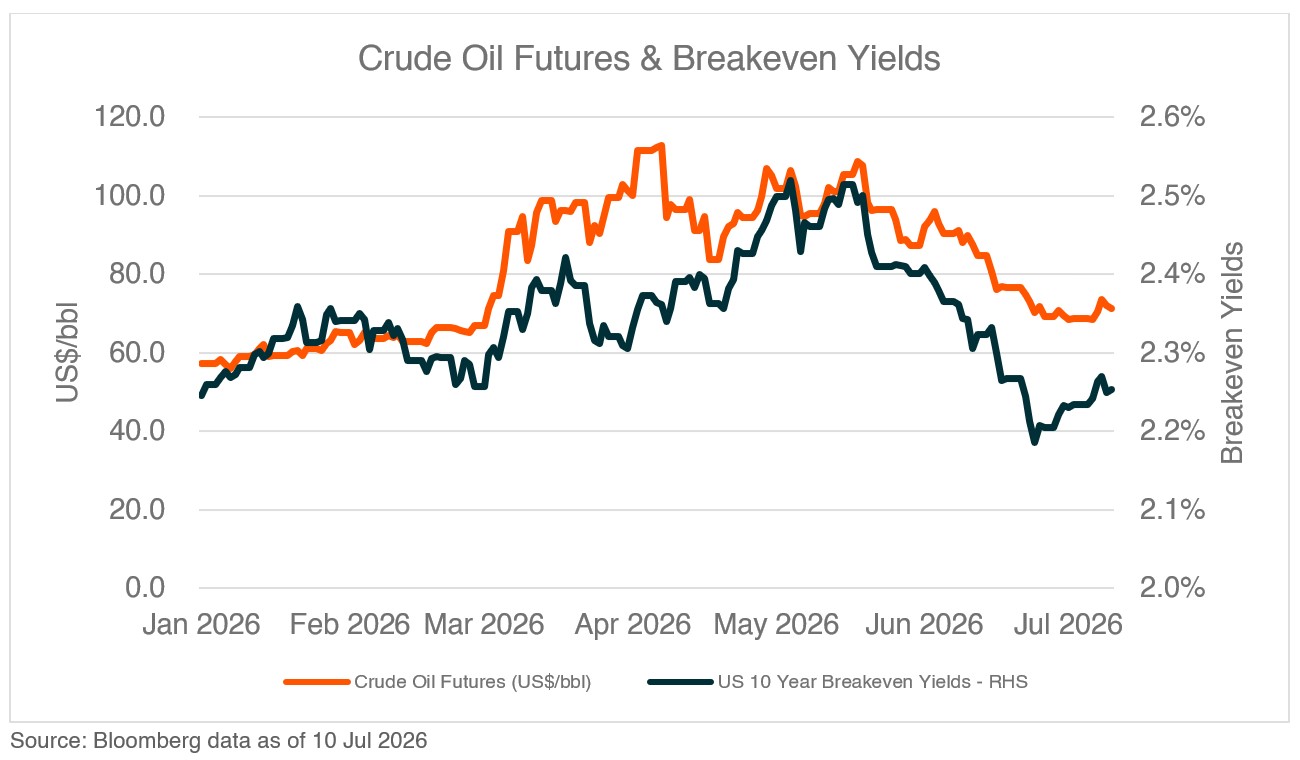
The sector does carry more leverage than the broader market on a net debt to equity basis, running at roughly 2.5% against approximately 1.5% for the S&P 5005, which leaves it somewhat more sensitive to the direction of the rate cycle than a typical large-cap benchmark constituent would be. More recently, crude oil and breakeven inflation expectations have moved together, both rising sharply through the spring before pulling back over May and June 2026, a co-movement suggesting broader inflation expectations easing rather than a single commodity correction, a further tailwind for input costs across the sector on top of the structural case already made.
What makes this supportive backdrop additive rather than central to the thesis is the nature of the constraints underpinning the structural argument outlined above, since switchgear lead times, transformer manufacturing capacity, and a labour market that has normalised after a period of elevated wage growth are all multi-year physical realities that don't reprice with the next OPEC meeting or Federal Reserve decision. Falling oil prices and a steadier rate environment are a genuine tailwind for the sector today, compounding on top of the earnings visibility already discussed, but the durability of the investment case was never contingent on either holding in place.
Accessing the US Domestic Physical Sovereignty Layer
The market treated this year’s outperformance as a name to rotate out of once AI dominated the conversation, when the more accurate read is that legislated spending and constrained supply chains don’t need a catalyst to keep compounding. Backlogs execute regardless of what’s leading the news cycle, production bottlenecks don’t resolve on the market’s timeline, and a valuation multiple that hasn’t re-rated is a sign the opportunity is still ahead rather than behind.
The Global X US Infrastructure Development ETF (PAVE) is designed to capture this cycle, holding the US contractors, engineers, and materials companies executing the largest domestic infrastructure investment cycle in a generation, positioned across the businesses benefiting from both the legislated spending backlog and the physical capacity constraints keeping pricing power with suppliers rather than buyers. Our view is that the market has not yet priced the earnings trajectory that follows, and for investors willing to look through the noise of the AI narrative to the reality of what is being built underneath it, PAVE offers a way to access it.
Considerations for investing
All investments involve risk. An investment in this fund may be affected by risks related to: Markets, Investment Objective, Index Tracking, ETF Pricing, Liquidity, Currency, Concentration, & Emerging Markets. The nature and level of risk may vary depending on the fund’s investment strategy and assets. The value of your investment can rise or fall, see the PDS for a full list of risks.